
 by Rich Falk-Wallace
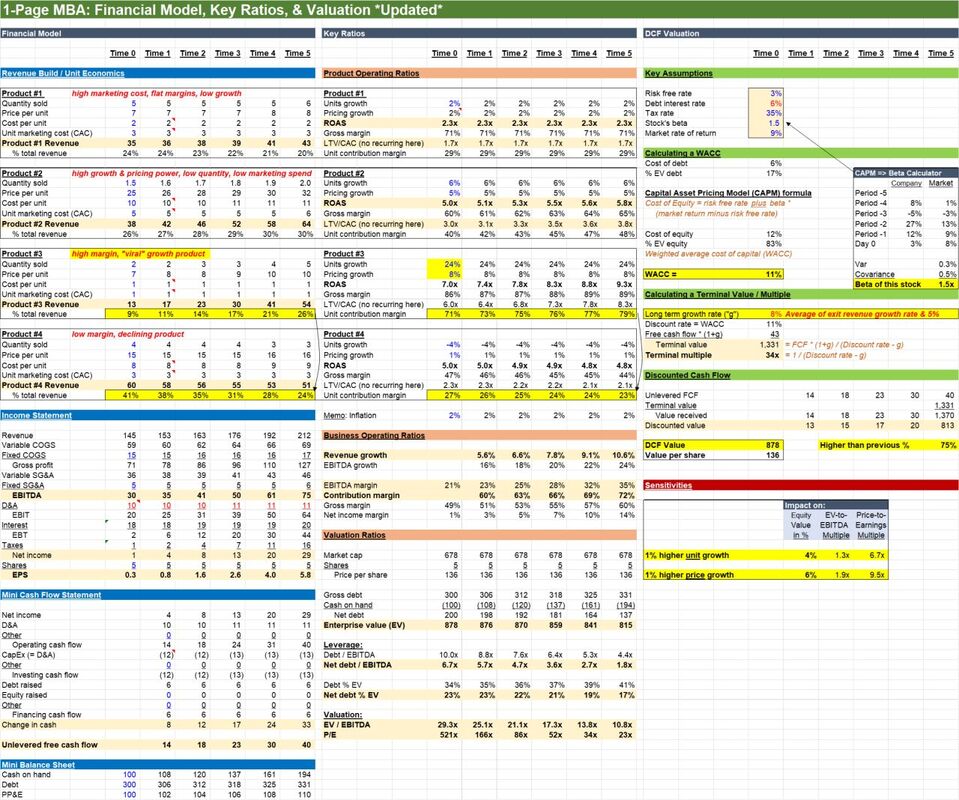
But you better know the math cold. Like & comment if you want the new excel. 6 topics: First, the update: 2 new divisions to illustrate an essential point. #1 Low margin decliner at 40% of start revenue #2 High margin "viral" growth product at 10% of start revenue Start & end revenue set to be identical to the last file. But the valuation almost doubles. Why? 6 topics: *1) Unit economics* Builds unit economics to company financials. Quantity per unit, growth. Unit price, cost; unit marketing spend. Drive return on ad spend (ROAS), customer acquisition cost (CAC), LTV/CAC, gross margins (GM). Model sets up four products: A high margin, low price power, low growth product vs. a low GM, better pricing power, better growth, lower unit market cost product vs. a high margin "viral" growth product vs. a low margin, declining product To show the dynamics of each over time. And their impact on the model and on value. *2) Accounting* Units flow to revenue, variable COGS, SG&A. Into EBITDA, EBIT, EBT, Net income & EPS. Simple cash flow statements & balance sheets reconcile D&A to inflation-adjusted replacement CapEx, debt, & GAAP PP&E. You need accounting fluency to look at equities. Not because accounting matters. But because it can obscure what matters. *3) Operating ratios* Units output financials, which drive ratios. Rev & EBITDA growth, margins. Contribution margins (= change in profit over change in revenue) Net debt-to-EBITDA, net debt % of EV *4) Valuation* You can drive valuation on multiples or DCF Which are equivalent: The discount rate minus growth rate = the 'terminal multiple.' Using a P/E instead of a DCF just uses next year as the terminal value. DCF here mapped to multiples. So why did this valuation double with the same start & exit revenue? Short version: Contribution from the high growth but small starting product. Leave the exit business with higher margins And higher terminal growth. But the long version in the math. *5) Corporate finance & DCFs* DCF here using the CAPM Beta from returns, cost of debt = WACC: the theoretically right discount rate DCFs are assumption laden - you get out whatever you want. But realistically: Your banker (or analyst) will make the math show a 7-13% discount rate. Varying with risk, industry, market - and whatever they want to achieve. *6) The hard part* This then sensitizes value and multiples to unit and price. Bringing unit drivers full circle to valuation outcomes. Ultimately, the math isn't the hard part. You need fluency in the math, its nuances and its limits. But once you are, you also have to shift focus. To the hard part. Which is filling in the numbers. If you’re investing, that means thoughtful unit drivers; how, when, and why they shift. And if you're building, it means making the numbers on the page happen. That's all for now.
0 Comments
Leave a Reply. |
Archives
July 2024

|